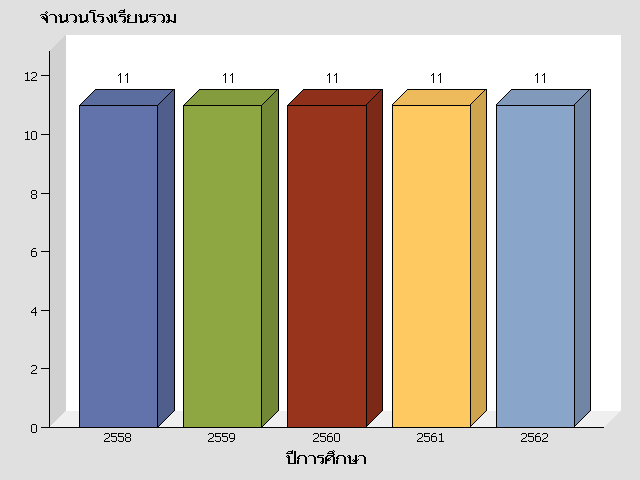
This graph is a 3-D vertical bar chart of 'ปีการศึกษา', with a sum response variable of 'จำนวนโรงเรียนรวม'.
The following table contains the data from the graph: